What the diagnostic actually hands you.
One fictional company, Northwind Analytics, taken through the 44-point diagnostic and two of the eight repair engines. Every screen below is the real tool, not a mockup.
66 seconds · silent · 3.3 MB, nothing loads until you press play
Forty-four questions, then a ranked repair list.
Northwind is a $15M ARR analytics company. Their team answers 44 questions across the seven layers that carry SaaS revenue. The instrument scores each layer, finds the weakest, and ranks the ten repairs worth starting.
The output is the deliverable. One click exports the whole thing as a confidential PDF a consultant hands to a CEO, or pre-circulates before a board meeting.
- Composite score
- 52 / 100
- Tier
- At Risk
- Weakest layer
- Expansion, 38
- Top repair
- C-06, week one
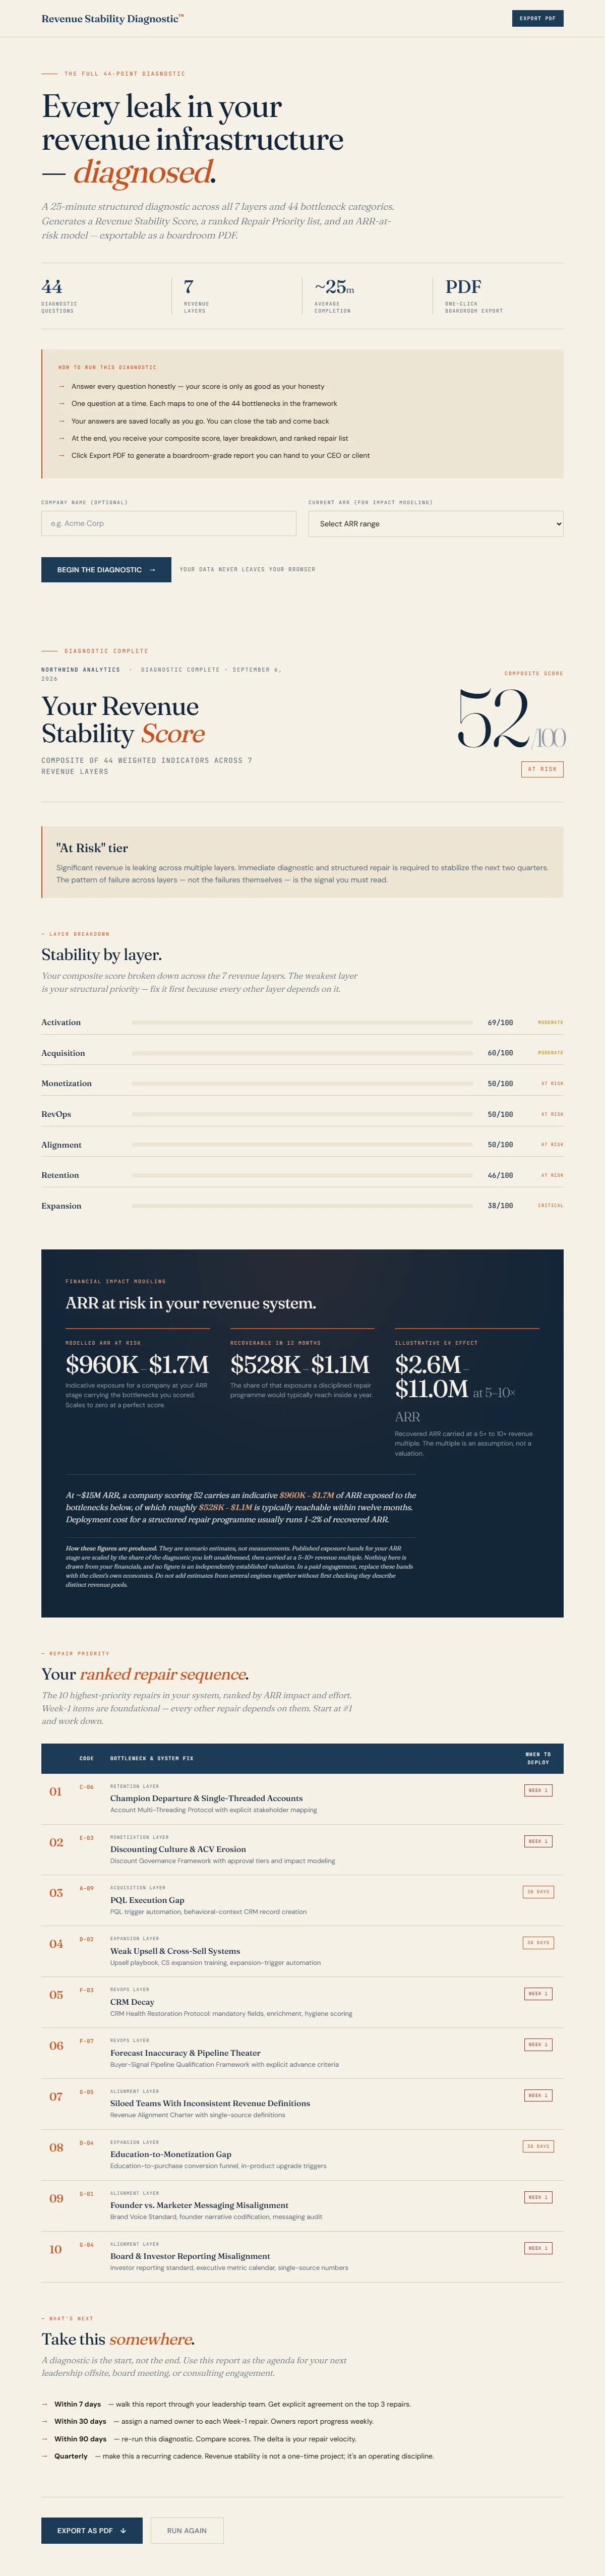
Scroll the frame · full diagnostic report
Six board numbers, each pointing at the engine that owns it.
The Executive Oversight engine is the view a CEO and a board see. Six metrics scored against their benchmarks, then every flag routed to the engine responsible for repairing it, ordered by what it costs.
Northwind looks healthy on growth and fails on churn. Logo churn at 13% is flagged first, because lost logos compound against every growth dollar behind them.
- Rule of 40
- 44.4
- Net revenue retention
- 108%
- CAC payback
- 20 months
- Logo churn
- 13%
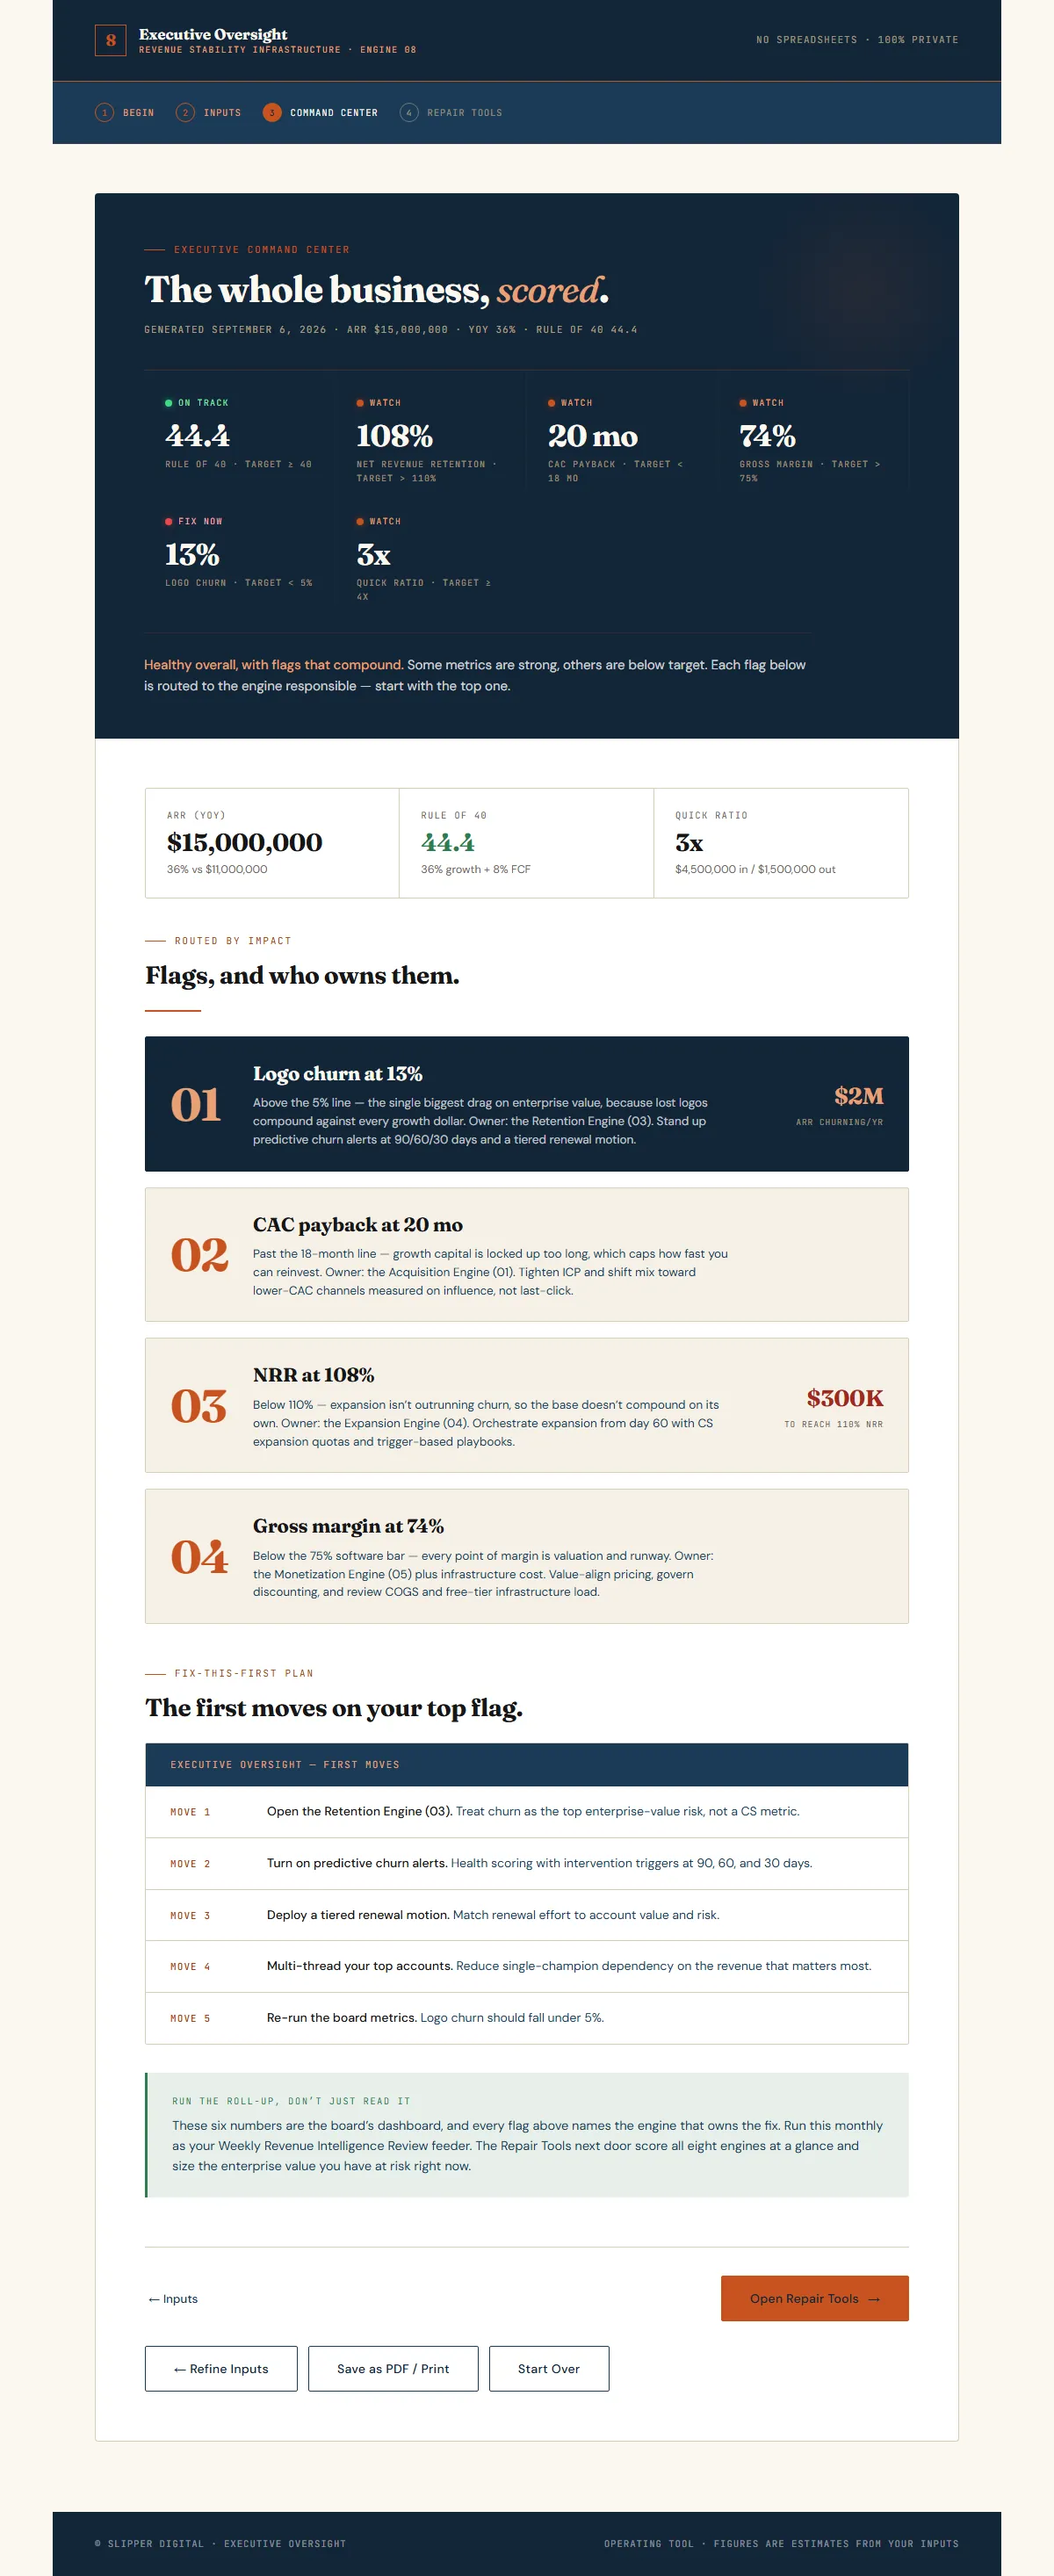
Scroll the frame · executive command centre
The flag opens the engine that fixes it.
Churn routed to the Retention engine. Same four steps as every other engine: enter the numbers, read the KPIs against benchmark, see the leaks ranked by dollar impact, then run the two repair calculators.
Each engine ships with a Word operating manual carrying the benchmark logic and the workflow behind it. The tool does the arithmetic; the manual is what you actually deliver against.
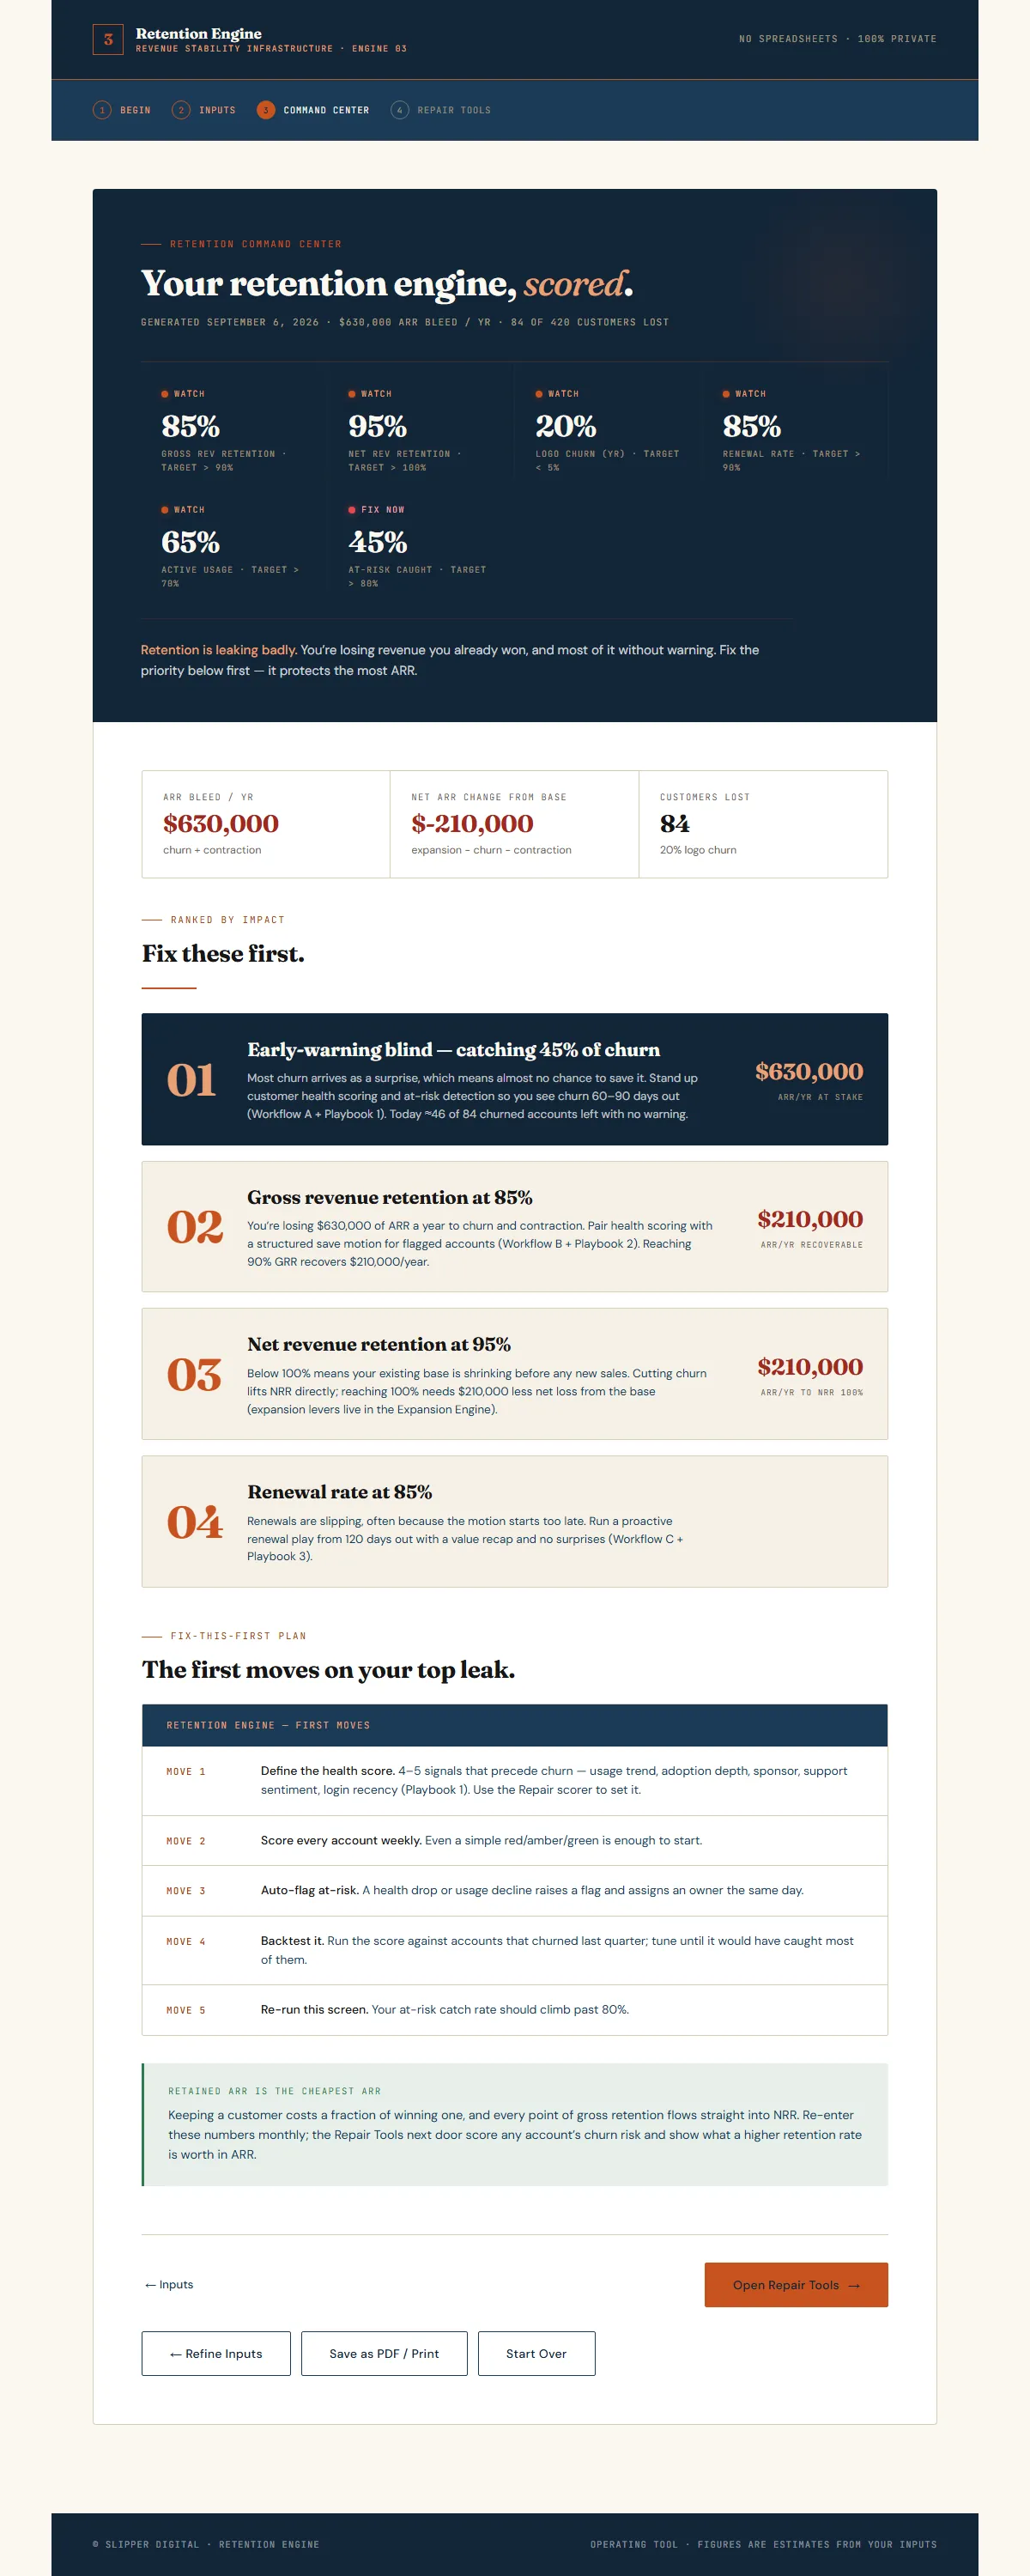
Scroll the frame · retention engine
What these numbers are, and are not
- Northwind Analytics is fictional. It exists to show the workflow. No client data appears anywhere on this page.
- Every figure is calculated from numbers someone typed in. Exposure bands for the ARR stage are scaled by the share of the diagnostic left unaddressed, so a perfect score returns zero, and the result is shown as a range carried at a 5–10× revenue multiple. The multiple is an assumption. Nothing here is a measured loss or an established valuation.
- The tools run entirely in the browser. They connect to no CRM, hold nothing outside the machine they open on, and there is no live feed behind them. They fetch their typefaces from Google Fonts the first time you open them online; nothing else leaves the machine.